

These videos are based on a session I presented at the PowerApps4Kids APAC meetup- for kids to learn how to graph survey results with Power Platform. Follow along to try it yourself! In this exercise you will create a form to collect survey results, and send the results automatically to Power BI where you can create your graphs. Pause the video as you go along to work at your own pace. Comment on this post below if you have any questions.
The videos are broken up into 4 parts, which you will need to complete in order:
- Set Up: Creating a Microsoft account to do the exercise
- Create the survey: Use Microsoft forms to create a survey
- Send the data to Power BI: Create a dataset in Power BI and use Power Automate to build a “flow” that will send the survey results to this dataset.
- Create your graphs: Pick and design your graphs in Power BI to visualise your results
1. Set Up
You will need help from an adult for this part as you will need to sign up for a Microsoft trial with a work email address. You can use the account you create for 30 days. After that, it will expire.
- Sign up for the free trial here: https://www.microsoft.com/en-au/microsoft-365/enterprise/office-365-e3
- Access Power BI here: https://powerbi.microsoft.com/
2. Create the survey
- Create a survey with Microsoft Forms at https://forms.office.com/
3. Send the data to Power BI
- Access Power BI here: https://app.powerbi.com/
- Access Power Automate here: https://flow.microsoft.com/
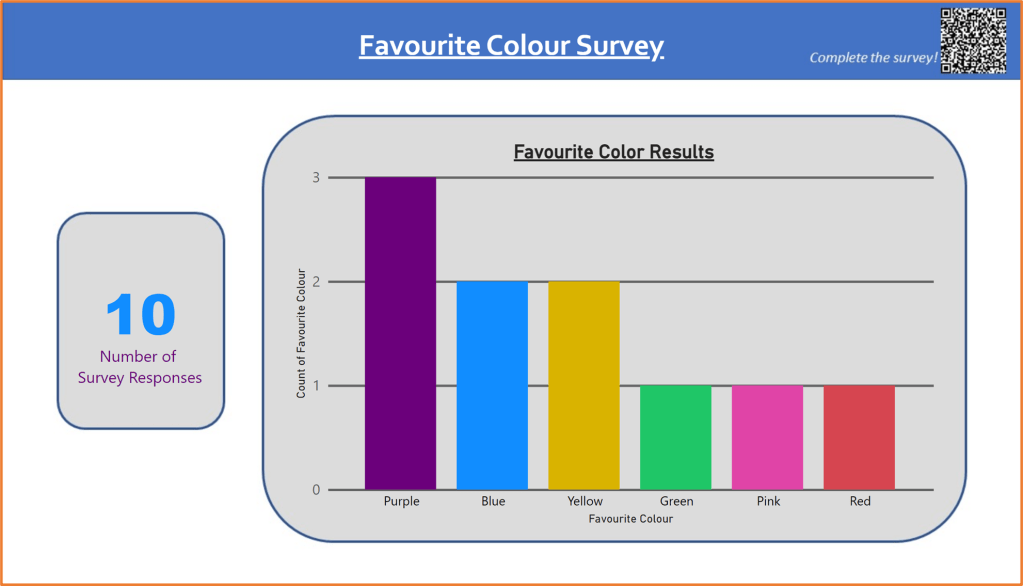
4. Create your graphs
- Access Power BI here: https://app.powerbi.com/
- To use the background template for the Power BI report shown in the video, click here to download it. Simply right click on the image > Save image as.
